Alternatives to Fathom, Syft, and Causal for Multi-Entity Finance: Evaluate the Layer Before the Tool
Comparing finance tools? First diagnose whether the issue sits in reporting, consolidation, source systems, or analysis.

Executive summary
- Start with diagnosis: Identify where the finance workflow breaks before comparing tools.
- Compare by category: Fathom, Syft, and Causal/Lucanet do not solve the same problem in the same way.
- Separate the layers: Multi-entity pain may sit in presentation, consolidation workflow, source systems, or analysis.
- Check workflow fit: Consolidation features matter, but so do mappings, FX, entity structures, and review steps.
- Watch the middle layer: The hardest work often happens between accounting systems and finance outputs.
- Context matters: AI commentary only helps when the underlying finance logic is clear.
- GCC groups need care: UAE and KSA holding structures often make multi-entity complexity part of the operating model.
Day 5 of close. The board pack looks cleaner than last quarter. The numbers still do not feel safe.
That is often when finance teams search for alternatives to Fathom Syft Causal for multi-entity finance.
These tools can support serious finance workflows. Fathom and Syft are often evaluated for reporting and consolidation use cases. Causal, now part of Lucanet, sits closer to FP&A, planning, modelling, budgeting, and xP&A.
The mistake is comparing them before understanding which part of the finance workflow is broken.
Teams often compare dashboards, reporting packs, consolidation features, and AI commentary. Those questions matter. But they are not always the first questions.
The better question is:
Which layer of our finance workflow is actually broken?
Why finance teams search for alternatives to Fathom, Syft, and Causal
The search usually starts when the pain becomes visible.
The board pack takes too long. Consolidated numbers need too much checking. Entity-level reports do not roll up cleanly. The CFO cannot explain margin, cash, or revenue movement without asking finance to rebuild the model.
So the team starts comparing reporting, consolidation, and FP&A tools.
That is reasonable. But the evaluation can go wrong if every tool is treated as part of the same category.
Fathom is often evaluated for management reporting, forecasting, and performance analysis. Syft is often evaluated for reporting, dashboards, analytics, and consolidation workflows. Causal, now under Lucanet, should be evaluated more through an FP&A and planning lens.
Those distinctions matter because the pain may not sit where the tool looks strongest.
A finance team may think it has a dashboard problem when it actually has an account mapping problem. It may think it has a consolidation problem when the real issue is source-system alignment. It may think it needs AI commentary when the data does not carry enough context for useful analysis.
The buying process should start with diagnosis, not feature comparison.
Diagnose the finance layer before choosing alternatives to Fathom, Syft, and Causal
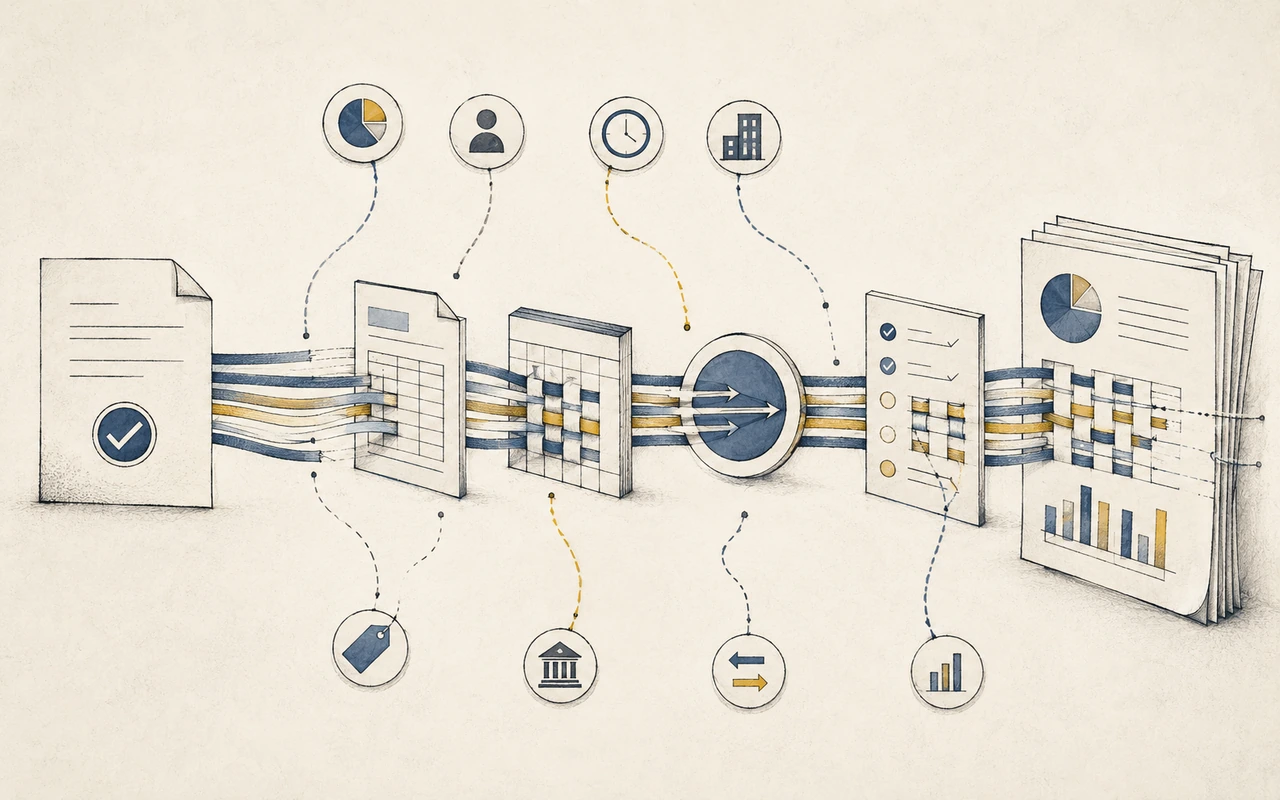
Multi-entity finance work usually breaks across four layers.
1. Presentation layer
This is the visible output: dashboards, board packs, KPI views, management reports, forecast summaries, and variance charts.
If the main problem is presentation, then a reporting tool may be the right answer. Finance already trusts the numbers. The issue is packaging, distribution, formatting, or readability.
But if finance still needs to rebuild or recheck numbers before putting them into the report, presentation is not the real bottleneck.
2. Consolidation workflow
This is where entity-level data becomes group reporting.
It includes account mapping, entity rollups, intercompany review, eliminations, FX treatment, ownership logic, and approval steps.
A tool may support consolidation. That does not automatically mean the workflow fits your group.
The real question is whether it can handle your entity structure, chart of accounts, review process, currencies, and reporting controls.
For a multi-entity group, workflow fit matters as much as the feature itself.
3. Source-system layer
This is where multi-entity finance gets messy.
One entity may use Zoho Books. Another may use QuickBooks. A larger subsidiary may use SAP Business One. Payroll may sit outside accounting. Banking data may come from portals. Some data may still arrive as Excel exports.
Native integrations help. But native integrations do not automatically solve the full system mix.
The source-system question is simple:
Can finance create a controlled reporting process across both connected and non-connected systems?
If not, the team still spends close collecting, cleaning, reshaping, and checking data before useful reporting starts.
This is the problem explored in The Integration Paradox: more connected systems can still create more finance work when they do not share the same logic.
4. Analysis layer
This is where finance explains why numbers moved.
A report can show that gross margin fell from 42% to 36%. That is the starting point, not the answer.
The CFO still needs to know whether the movement came from pricing, volume, customer mix, supplier cost, FX, delayed billing, or one underperforming entity.
AI commentary only helps if the system has enough context to explain the movement. If it only sees summarized accounting data, it may describe the variance without identifying the driver.
Finance needs to move from “what changed?” to “why did it change, and what should we do next?”

Where multi-entity finance breaks before the report
The failure points are practical. They show up in the same places every month.
Account mapping
Account mapping becomes fragile when each entity speaks a different finance language.
One entity uses “Sales Revenue.” Another uses “Product Income.” A third splits revenue into subscriptions, services, and usage. A new subsidiary brings an older chart of accounts from before the acquisition.
At group level, the mapping file becomes part of the control environment. The logic sits in a spreadsheet. The context sits in someone’s head. The review process depends on memory.
This is often the moment described in The Flagship Illusion: multi-entity complexity starts as soon as the second entity appears, not when the group becomes large.
Intercompany review
Intercompany balances should be routine. In many teams, they become an investigation.
Finance checks whether both sides booked the transaction, whether they booked it in the same period, whether the counterparty used the right account, and whether FX created a difference.
A consolidation tool can help here. But the evaluation should focus on traceability.
Can finance see where the mismatch came from? Can the team review adjustments before final reporting? Can the CFO understand what changed after the first close draft?
If not, manual checks remain part of the process.
FX treatment
FX creates two problems: calculation and explanation.
For a group reporting in USD with AED and SAR entities, finance needs to separate operating movement from currency movement.
Revenue may look higher at group level. But did the business grow, or did translation change the result?
If FX treatment sits outside the reporting workflow, finance may still produce correct numbers. But the explanation becomes harder to defend.
Fragmented systems
Many finance teams do not run on one clean system.
They run on a system mix: accounting in one place, bank data somewhere else, payroll outside the ERP, operational metrics in another tool, and legacy entities still sending Excel files.
This creates post-accounting work. Finance is translating data from different systems into a structure the group can use.
That middle layer is often invisible during tool evaluation, but it is where much of the time goes.
Kudwa fits when the issue is the post-accounting layer: the work between source systems and finance outputs. It does not replace accounting systems, ERPs, or every FP&A workflow. It helps multi-entity teams manage the finance logic that sits between them: mappings, consolidation context, cash visibility, reporting structures, and driver-level analysis.
Driver analysis
Driver analysis breaks when finance can show movement but cannot explain it quickly.
A variance report says revenue increased by 18%. The board asks why.
Was it one entity? Price? Volume? A delayed invoice? FX? A one-off contract?
If answering requires three exports, a spreadsheet rebuild, and a call with operations, the analysis layer is weak.
GCC example: UAE/KSA group with mixed systems
Consider a UAE-based holding group with operations in Dubai and Riyadh, plus one recently acquired subsidiary.
The group reports to the board in USD.
The UAE entity uses Zoho Books. The Saudi entity uses QuickBooks. The acquired subsidiary still sends Excel exports. A larger operating unit uses SAP Business One. Payroll sits outside accounting. Banking data comes from separate portals.
The board pack needs revenue, gross margin, cash, receivables, intercompany balances, and forecast movement by entity.
In this context, the problem is not simply “we need better dashboards.”
A dashboard can make the output easier to read. A consolidation workflow can help roll entities into group reporting. An FP&A tool can improve planning and modelling.
But the finance team still needs to answer operational questions.
Are charts of accounts aligned? Are intercompany balances reviewed before reporting? Are AED, SAR, and USD movements treated consistently? Can finance explain whether margin changed because of performance or FX?
That is why GCC context matters.
Many UAE and KSA groups operate through holding structures, free zone entities, acquired subsidiaries, and mixed systems. Multi-entity complexity is often the operating model.
The tool evaluation should reflect that.
Evaluation checklist before choosing a tool
Before choosing between alternatives to Fathom, Syft, and Causal for multi-entity finance, answer five questions.
1. Which layer is the main problem?
Presentation, consolidation workflow, source-system alignment, or analysis?
2. Are we buying for output or control?
A cleaner report helps. But if finance still has to rebuild, remap, and recheck the numbers before reporting, the issue is control.
3. Does the consolidation workflow fit our entity structure?
Check charts of accounts, currencies, intercompany balances, group reporting lines, review steps, and acquired entities with different systems.
4. Does the tool match our full system mix?
Look at the accounting systems, ERPs, banks, payroll tools, and spreadsheet sources finance actually uses.
5. Can finance explain movement without rebuilding the model?
If the report shows the variance but finance still needs hours to explain the driver, the analysis layer remains weak.
Closing
The issue is not whether a tool has dashboards or lists consolidation features. The issue is whether it solves the layer where your finance team actually loses time and control.
For some teams, that layer is presentation. For others, it is consolidation workflow. For many multi-entity groups, especially those with mixed systems, currencies, and legal structures, the real issue sits in the post-accounting layer.
That is the work between accounting and decision-making: mappings, consolidation context, intercompany review, FX treatment, cash visibility, reporting structures, and driver-level analysis.
If most of your reporting work happens before the report, book a walkthrough to see how Kudwa helps multi-entity finance teams manage the post-accounting layer.
Latest from Kudwa

Forecast vs Actual Reporting: Why the Variance Matters Less Than the Driver
Forecast vs actual reporting should explain timing, volume, price, mix, and one-offs so leaders can act on the real variance driver.
Finance Data Reconciliation Across Systems: Where Reports Start Breaking Before Month-End
Finance data reconciliation across systems helps teams explain revenue, payroll, billing, bank, and operational gaps before month-end reports break.