Understand what’s driving your performance
Get AI-powered variance and trend analytics, identify correlations, detect anomalies, and understand performance drivers across entities, products, and time without manual work.
.avif)

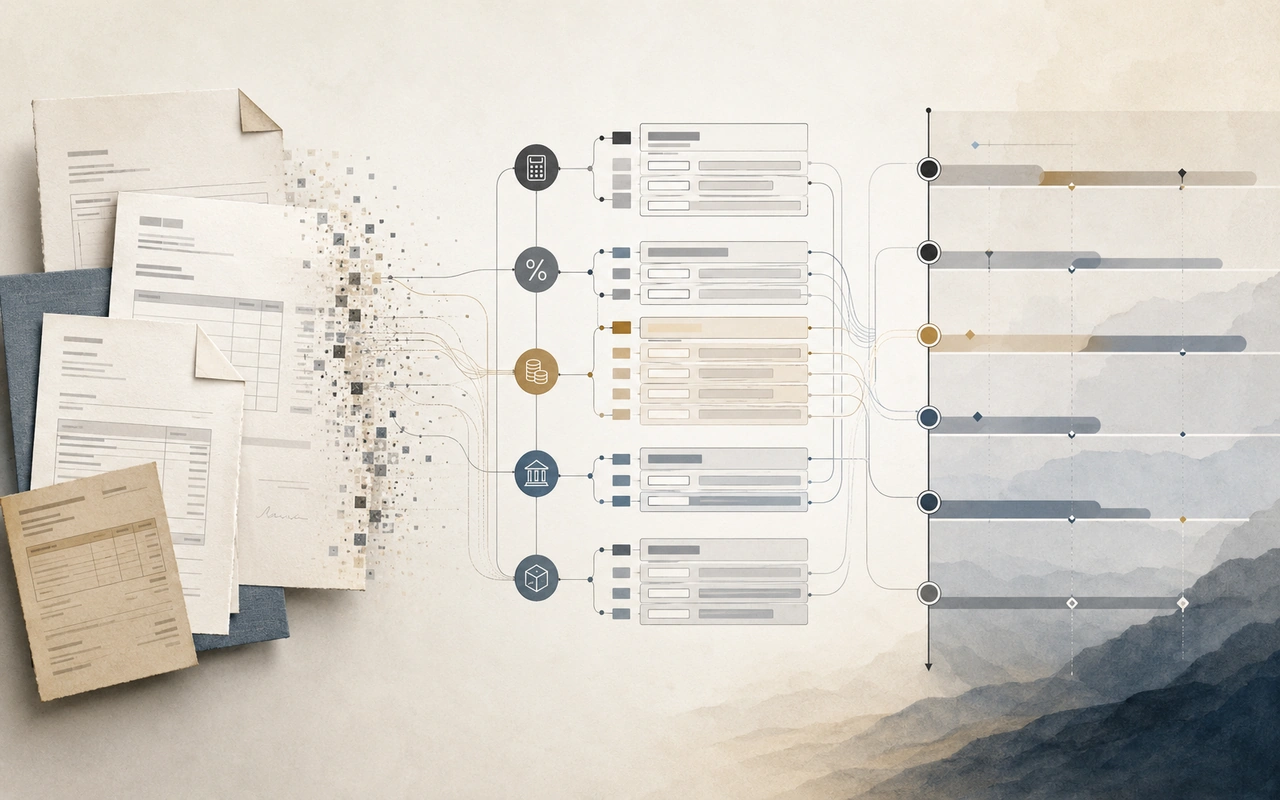
Inside the analytics engine
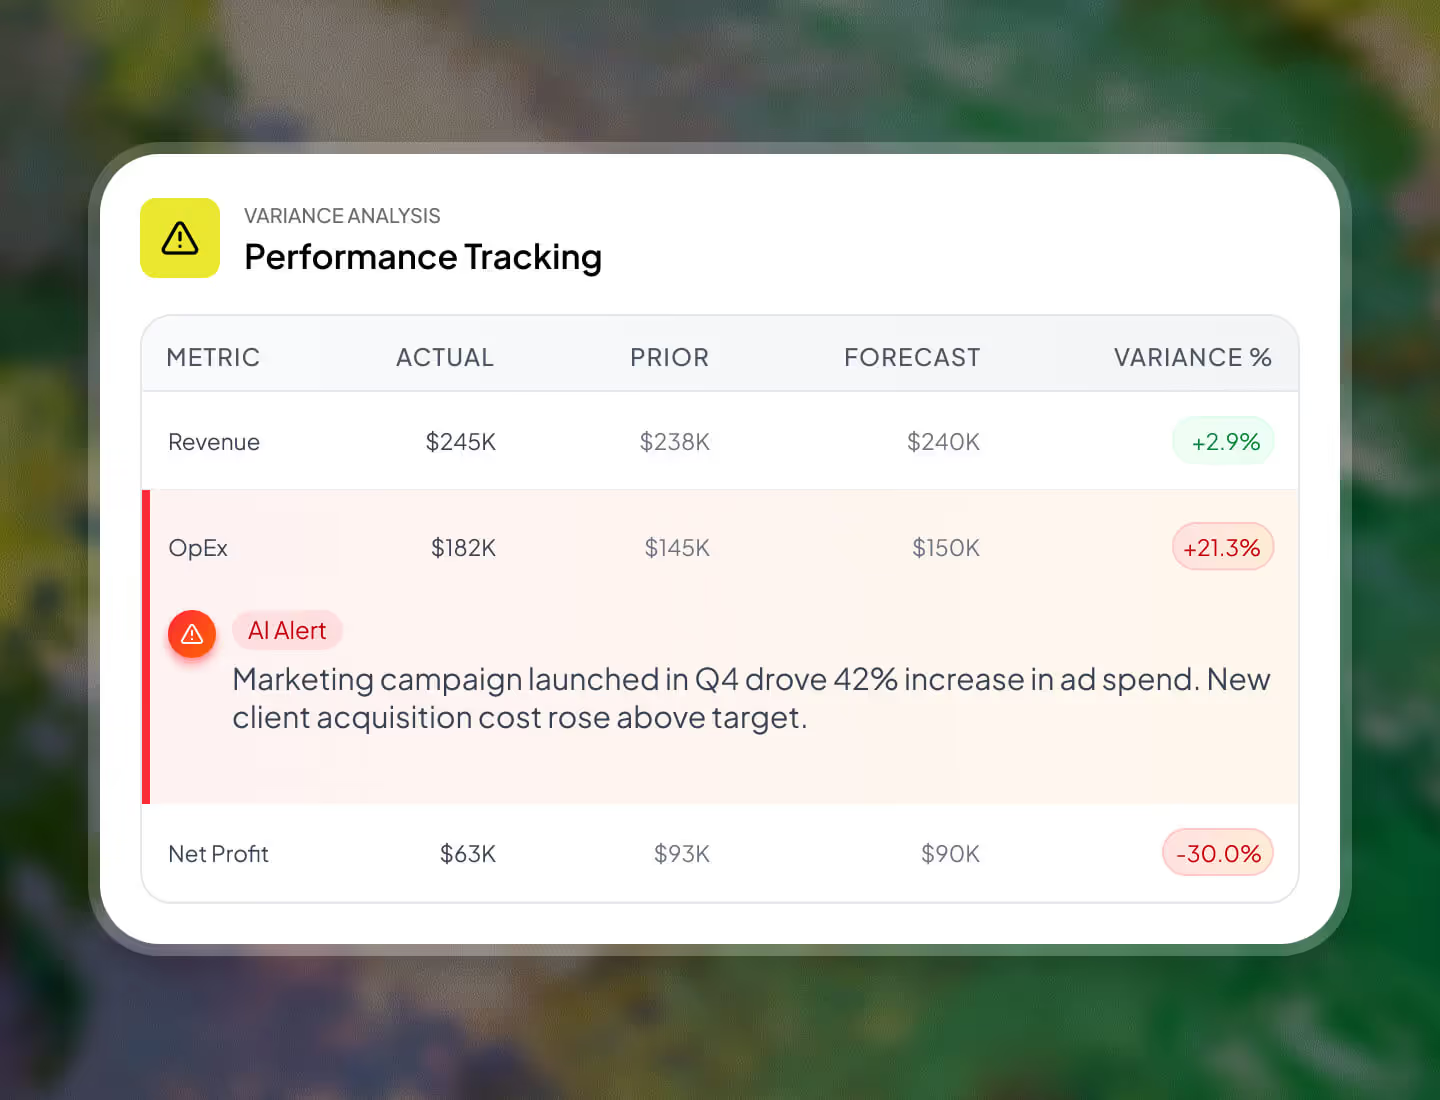
Identify variances across dimensions
Compare actuals to prior periods or forecasts by entity, department, or metric, all computed automatically and kept consistent.
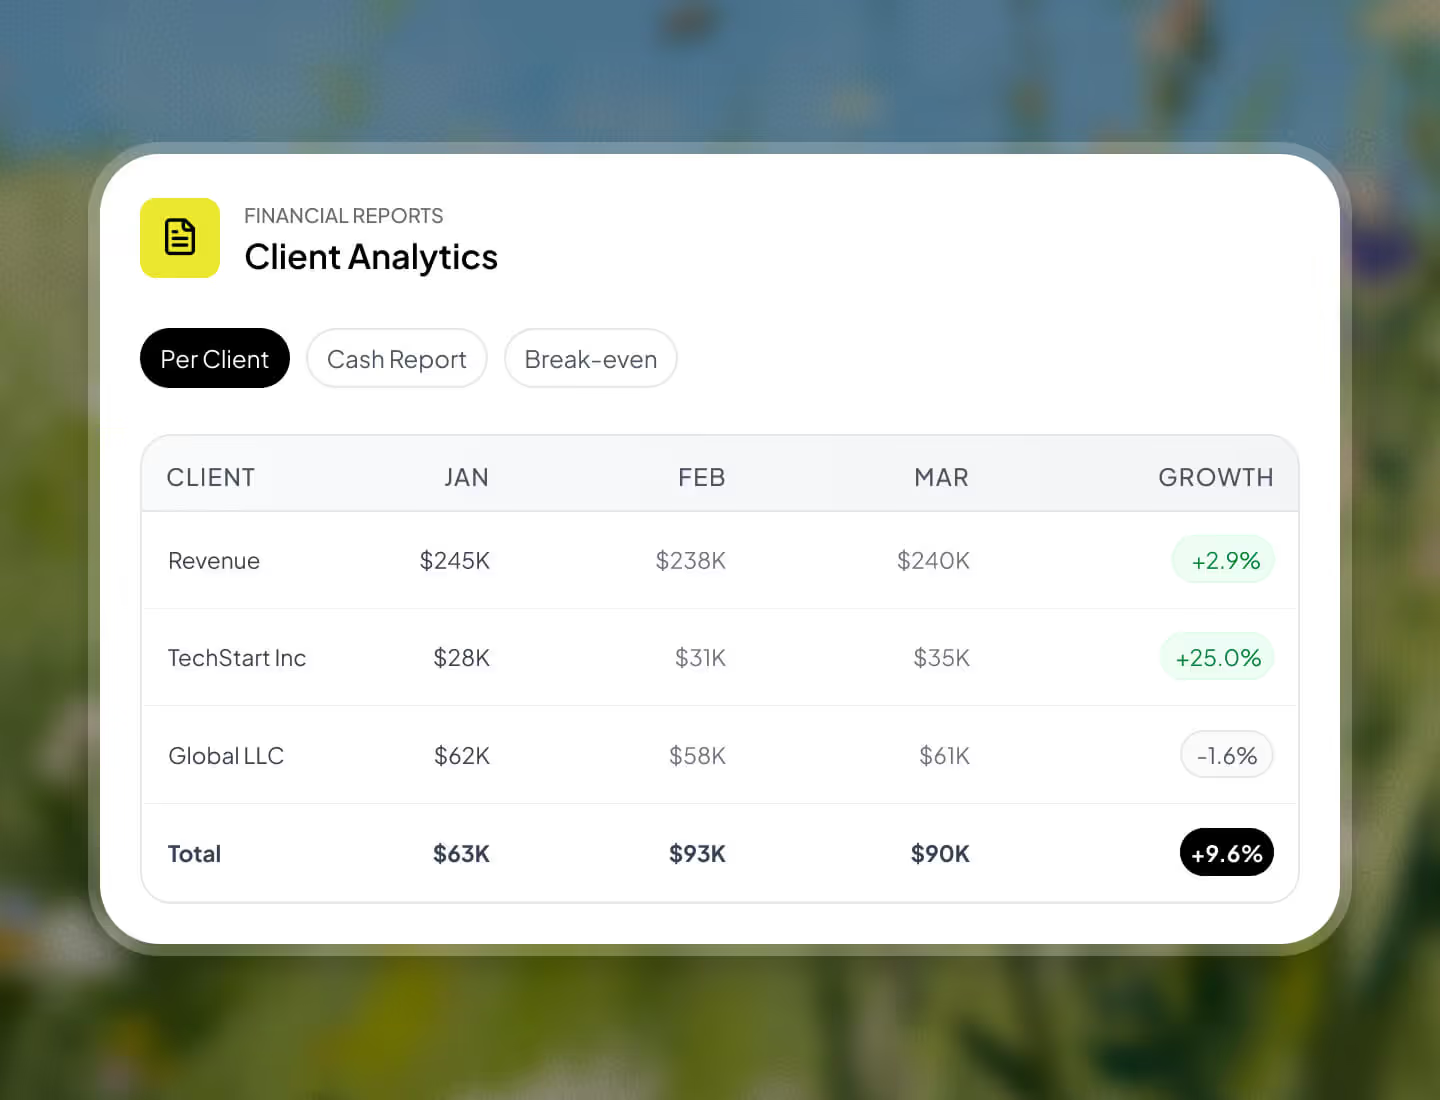
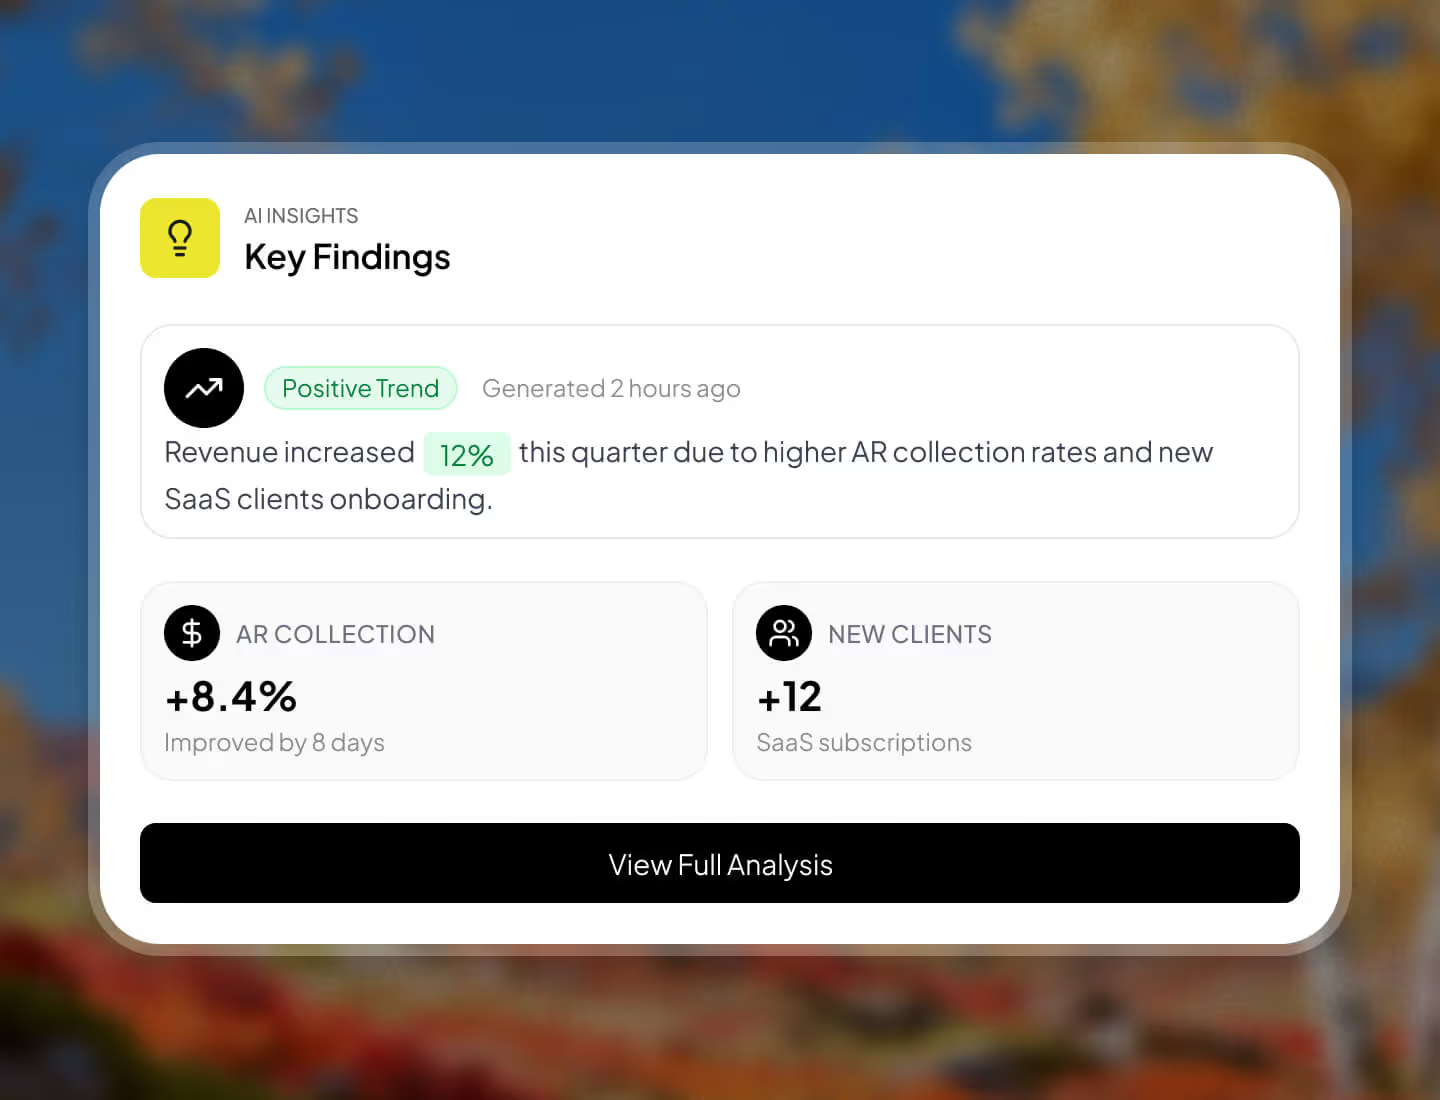
Get ready-made insights, instantly
Get immediate access to per-client profitability, break-even, and core financial metrics without building models or templates.
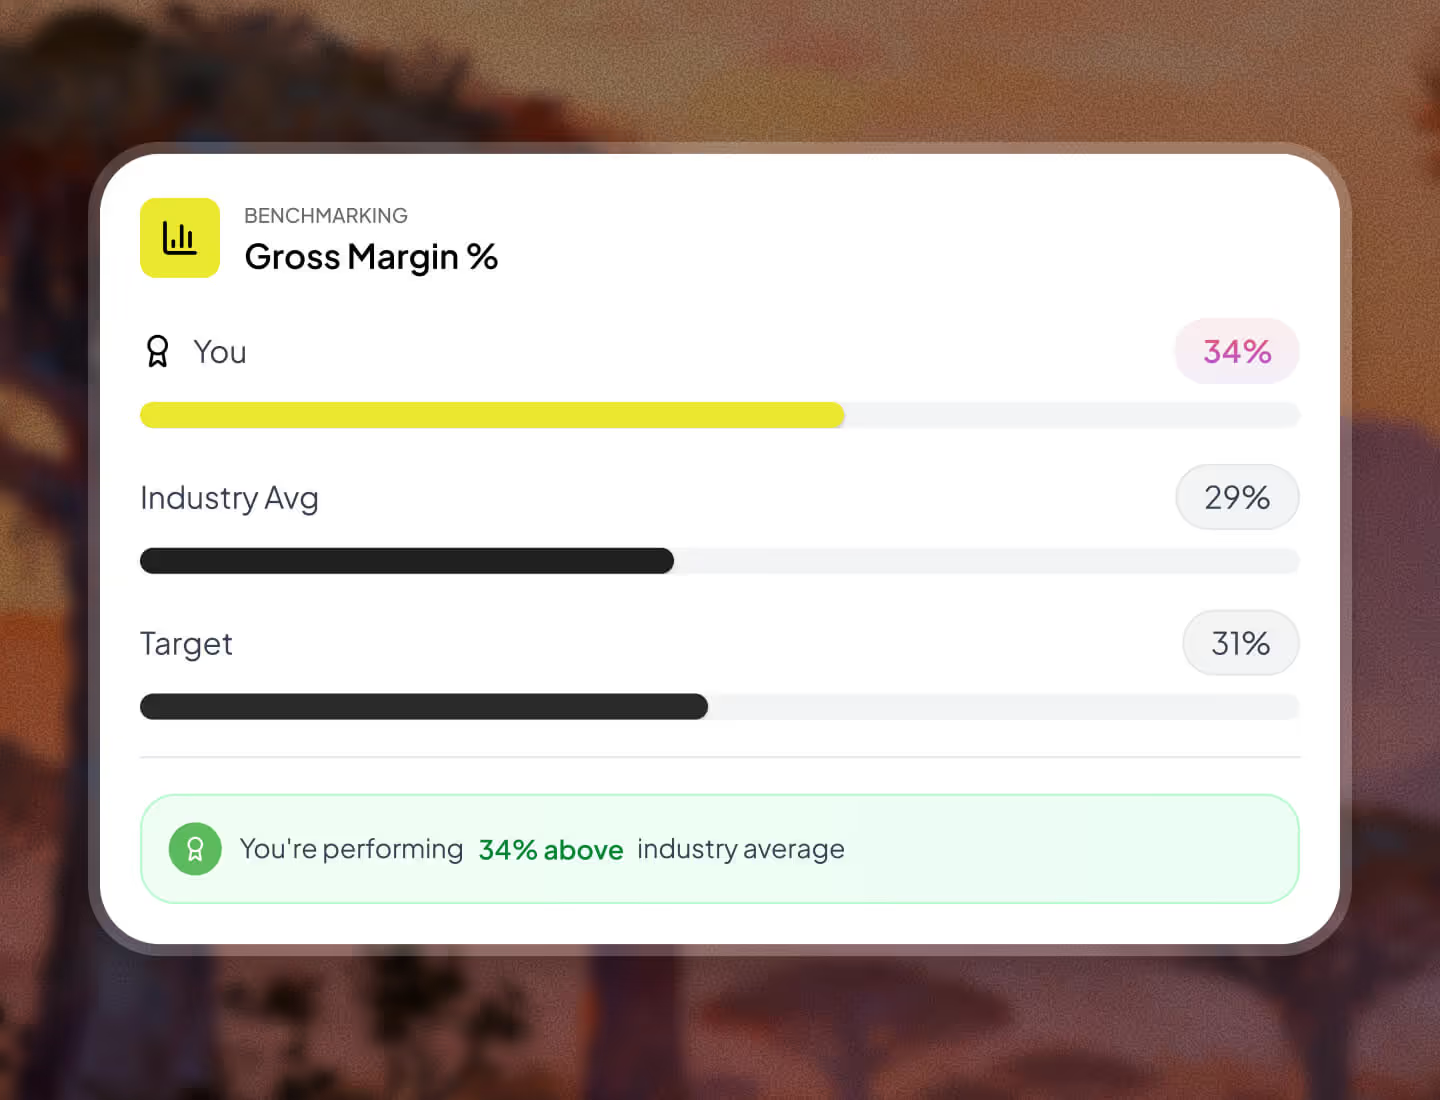
Use built-in smart benchmarking
Automatically compare performance against industry benchmarks, historical results, or internal targets without manual setup.
Get to the “why” instantly
Move from summary figures to underlying drivers and transactions in seconds, without manual investigation.
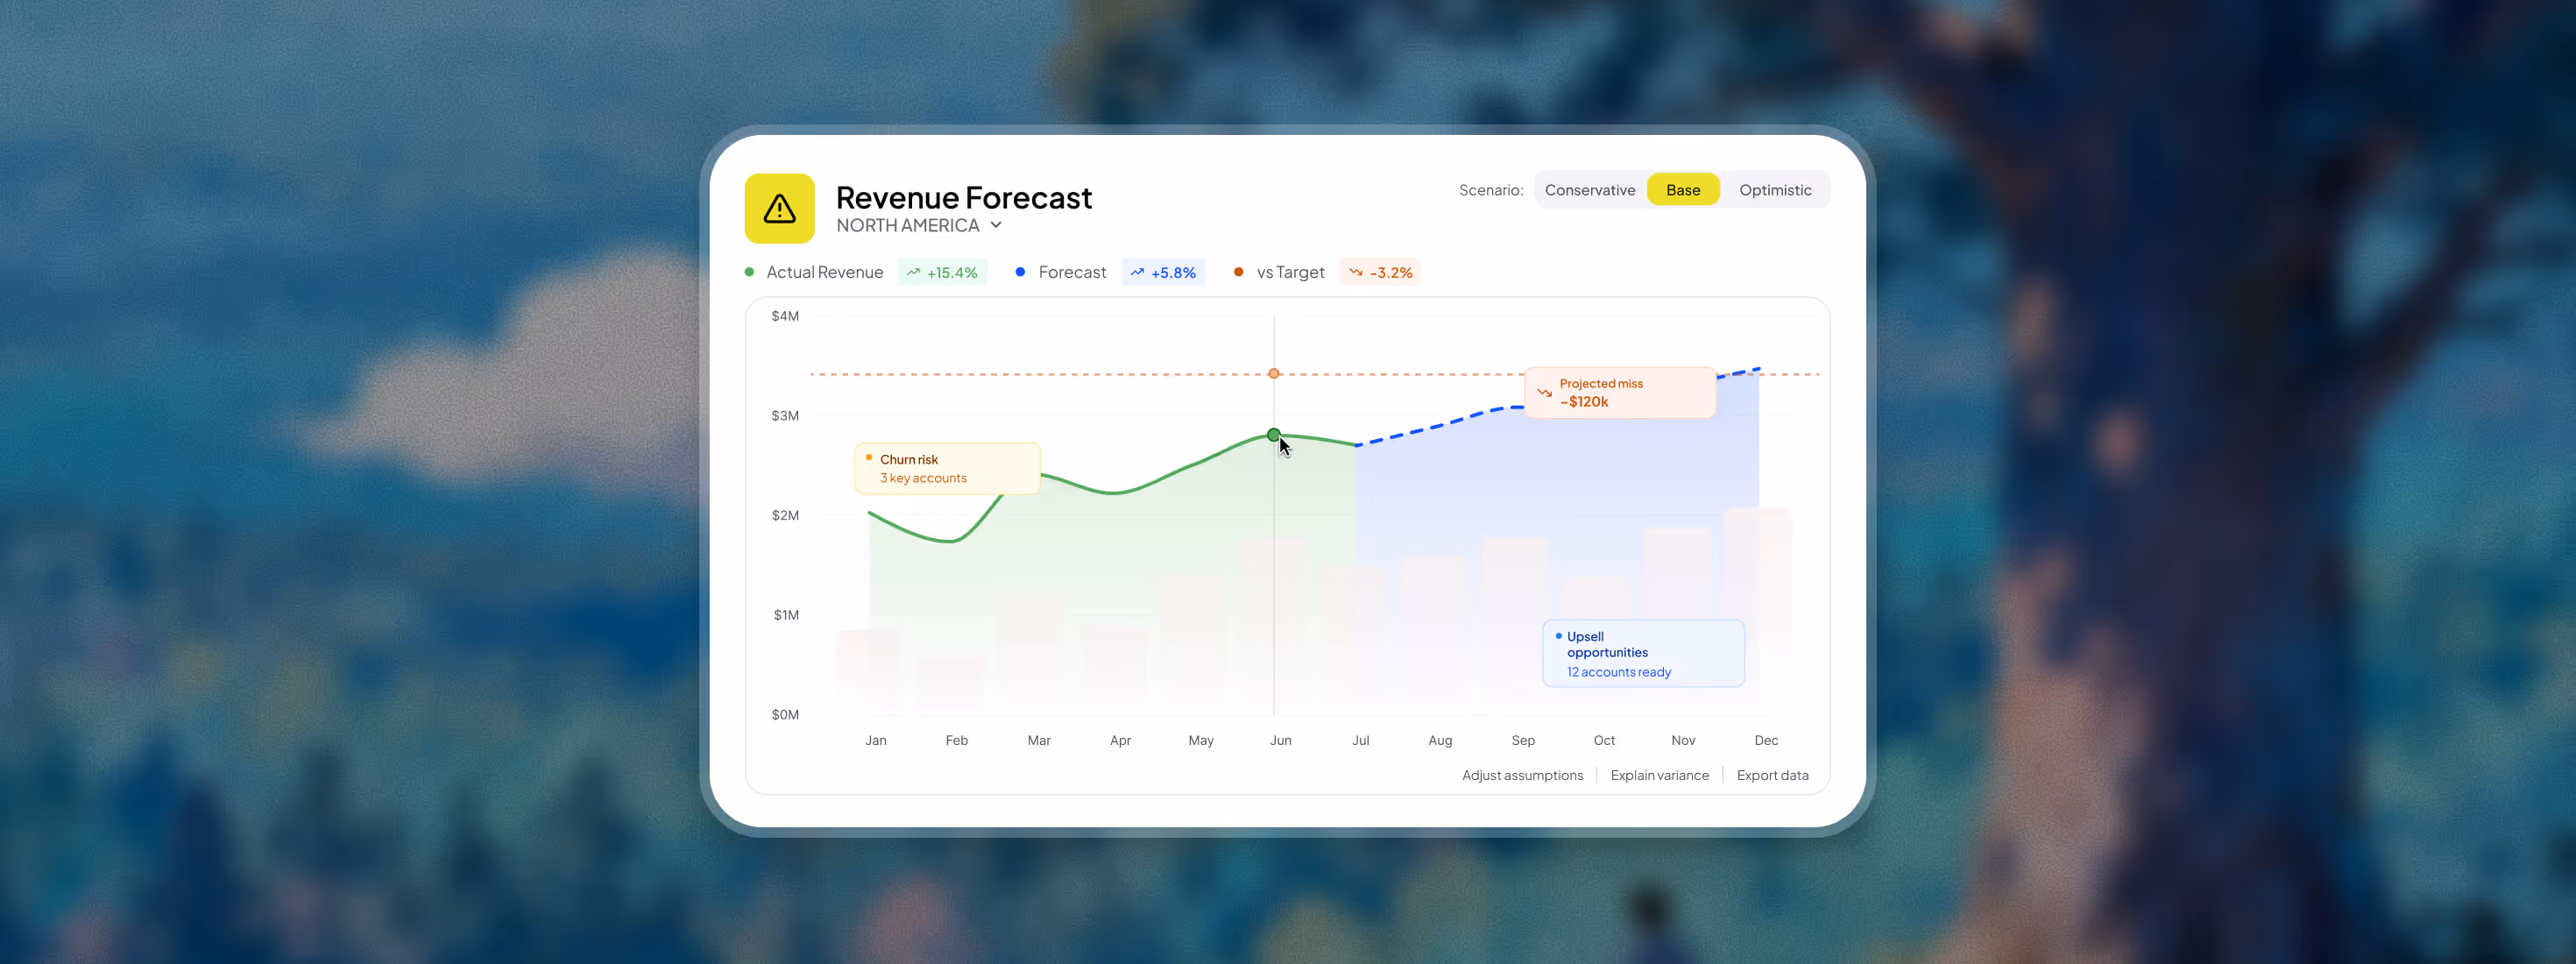
Plan ahead and move smarter
Forecast your performance by entity, client or department. Think strategically and act proactively to meet your targets.
What this solves
Speed
Move from question to answer in one place. No switching between tools, exports, or back-and-forth just to understand a number.
Clarity
Understand what changed, why it changed, and what is driving performance, not just what the numbers are.
Accuracy
Base your financial analysis on consistent, validated data instead of reconciled spreadsheets or conflicting reports.
Scale
Act on financial insight while it still matters, whether that means protecting margin, reallocating spend, or correcting performance early.
Faster decision cycles
Saved per quarter
Margin improvement

"Please don't give me a heart attack" is what I told Kudwa when they hypothetically asked what I would do if they would shut down tomorrow. Thats how useful their consolidation tool is. I have 10 entities and one single source of truth now.


We trialed and saw the potential within 2 days, we are now fully committed for a 2 year contract. Month-end multi-entity consolidation: very very good, not an easy feature to build and done well. But its not just about the time saved. By combining our financial reports with operational data, we have avoided many bad decisions.

Don't just take our word for it
I saved at least 3 days of manual work per month with Kudwa. Their tool saves me so much headache. On top of this, their customer service is so great they are always available to help!

With its intuitive interface, advanced analytics, and real-time data capabilities, Kudwa empowers us to make data-driven decisions and maintain compliance with ease. It not only enhances productivity but also builds trust with stakeholders through precise and timely reporting

Our clients love Kudwa for these three main reasons: super intuitive app, insights and not only numbers, powerful time saving. It really has international level capabilities and just keeps getting better every month.

Your questions, answered


Think of it as an analyst living inside your reports. It summarizes performance, calls out variances, points to likely drivers, identifies trends, forecasts your cashflow performance (and more) and helps you ask better follow-up questions in plain English.
From high-level performance down to transaction-level drivers. Kudwa can help with variance explanations, AR/AP insights, patterns, and anomalies.
Yes. Kudwa is made to be completely configurable. You can build custom KPIs and logic to match how your business actually runs.
Yes, you can sync both Excel and Google Sheets and connect your budget to your actuals. Kudwa also automatically matches actual and budget account with the same exact name to ease your experience.
You need to create your monthly management pack or board/investor view only once. You will then be able to reuse it with your latest data at a click of a button. This keeps reporting consistent and reduces last-minute scramble.
First hand news

Mainland LLC Compliance in the UAE: What Finance Teams Need to Track
Track Mainland LLC compliance in the UAE across corporate tax, VAT, WPS, GPSSA, Emiratisation, UBO, AGM, and licence items.