What CFOs Should Check Before Choosing Cash Flow Management Software
Evaluating cash flow management software? Skip the generic dashboard lists. Use this operational scorecard to assess.

Executive Summary
- Workflow mismatch: Many cash tools focus on visual presentation rather than fixing the underlying manual aggregation workflows.
- Entity friction: Standard cash software assumes a single treasury pool, ignoring regional transfer limits, entity boundaries, and multi-currency conversions.
- Timing disconnects: Cash visibility breaks when bank feeds, AP runs, payroll schedules, and AR ledgers update on completely separate timelines.
- Traceability loss: Traditional BI dashboards show aggregate balances but prevent finance teams from drilling down into specific general ledger transactions.
- Evaluation framework: Software selection should depend entirely on your operational complexity—specifically bank fragmentation, multi-entity needs, and forecasting workflows.
The cash report on your desk says the company has $1.8 million available. The board pack uses exactly that number. However, the bank portals show a different aggregate balance. The accounts payable run removes $420,000 tomorrow morning, payroll has not yet hit the model, and one regional subsidiary cannot transfer its local cash without regulatory approval.
This is the moment evaluating cash flow management software stops being a "nice dashboard" design choice and becomes a structural control question.
When a business scales past $1 million in revenue, managing treasury via manual spreadsheets becomes a liability. The immediate reaction is often to look for specialized cash flow management software. But if you choose a tool based entirely on how clean its graphs look, you risk duplicating the exact manual processes you are trying to escape. If your team still has to manually pull ERP balances, paste aging schedules, and normalize exchange rates before the software can display a chart, you haven't solved the operational bottleneck. You have just built a prettier spreadsheet.
Why the Baseline Cash Process Fails as Complexity Scales
In a single-entity setup with one primary bank account, cash visibility is straightforward. The finance manager opens the bank portal, checks the balance, updates a basic spreadsheet, and references the accounts receivable aging report to estimate cash inflows for the next 14 days.
This process breaks when the business adds operational layers:
- Multi-bank fragmentation: Cash is split across different jurisdictions, currencies, and institutions.
- Ledger isolation: Different subsidiaries use separate instances of accounting systems, meaning AR and AP transactions sit in silos.
- Timeline mismatches: A bank statement reflects historical cleared transactions. The AR ledger reflects invoices raised but not collected. The AP run reflects approved bills, while procurement software contains commitments that have not yet turned into bills.
When these schedules do not align, your cash forecast becomes unreliable. This operational breakdown explains why finance teams keep exporting from their ERP back into spreadsheets—the source systems are fundamentally disconnected from the actual timing of cash movements.
The Specific Mechanism of Failure: Output vs. Workflow
The primary trap when purchasing cash tools is buying for the visual output instead of the underlying data workflow. Consider an operational scenario common to companies scaling across the GCC region:
A parent company based in the UAE views its AED bank balances in real-time. Meanwhile, its Saudi Arabian subsidiary handles local operations, tracking collections in SAR via an isolated accounting instance like Wafeq or Zoho Books. If the corporate finance team has to log into Saudi bank portals, convert SAR to AED or USD using manual spot rates, pull an AP schedule from an Odoo instance, and adjust for a local corporate tax or VAT deadline on a spreadsheet, the software has failed.
If the software requires manual preparation before it can display a trendline, it is an expensive presentation layer, not an automation tool. It obscures the fact that one entity may be unintentionally funding another due to transfer delays or local liquidity restrictions.
Cash Flow Management Software: The Operational Evaluation Scorecard
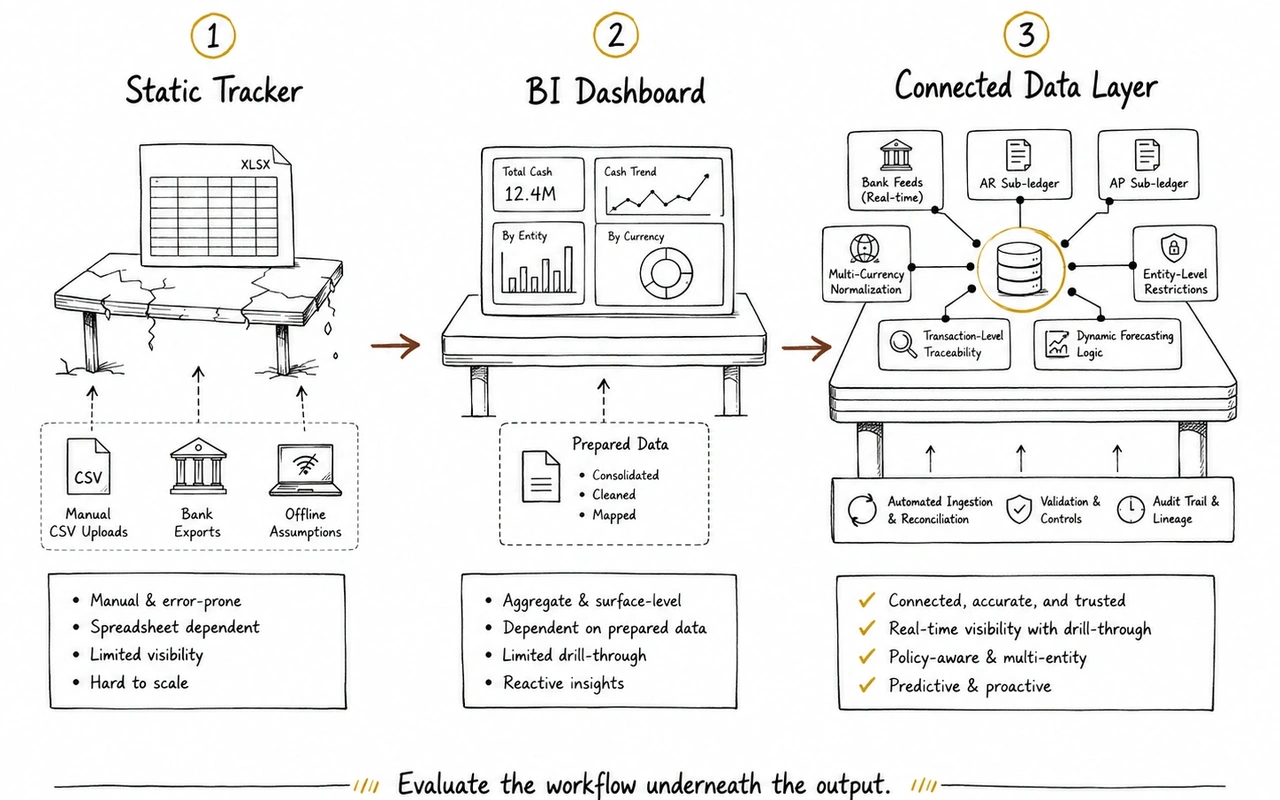
A basic cash tool usually starts as a static tracker. It depends on manual CSV uploads, simple bank exports, and offline assumptions. It may help organize cash reporting, but it does not solve the workflow if finance still has to gather, clean, and normalize the data manually.
A more mature tool acts like a BI dashboard. It gives finance a cleaner view of balances, trends, and high-level movement. This is useful, but it can still fall short if AR, AP, payroll, bank feeds, and entity-level restrictions are not connected underneath the surface.
The strongest setup is a connected data layer. This means the software can ingest bank data, connect to accounting and sub-ledger systems, normalize currencies, separate entity-level restrictions, and let finance trace cash movements back to source transactions.
The difference matters.
If the tool only shows aggregate cash balances, it is still a presentation layer. If it connects bank, ledger, AR, AP, and entity data into one operating view, it becomes part of the finance control layer.
Before buying, finance leaders should check five areas: bank data ingestion, multi-entity and multi-currency support, sub-ledger integration, traceability, and forecasting logic. The goal is not a cleaner chart. The goal is less manual preparation, faster variance explanation, and a cash view finance can actually defend.
Evaluating the Infrastructure Before the Tool
Before comparing specific software brands, finance leadership must analyze the data layer beneath the reporting outputs. If you layer a visualization tool over fragmented underlying systems, your reporting remains out of sync. This challenge is why finance teams must look closely at alternatives to Fathom, Syft, and Causal for multi-entity finance—many standard analytics tools assume your data is already clean, unified, and mapped correctly before it arrives.
This issue is amplified in group environments. When assessing multi-entity consolidation software, the core problem is rarely formatting the final PDF report. The problem is mapping different charts of accounts, managing intercompany eliminations, and identifying exactly which entity holds usable cash versus cash that is legally or operationally locked in a localized subsidiary.
When Does a Dedicated System Become Necessary?
A specialized system transitions from a luxury to permanent infrastructure when cash visibility consumes multiple hours of your finance team's week. Look for these specific operational triggers:
- The variance loop: Your actual weekly cash ending balance varies from the forecast by more than 10%, and your team spends hours running variance analysis just to identify which customer invoice or vendor payment caused the swing.
- Reconciliation latency: You cannot get an accurate view of consolidated group cash until Day 10 of the monthly close because bank data from different subsidiaries must be manually normalized.
- Decoupled reporting: Your cash flow model lives completely separate from your P&L and Balance Sheet models, leading to situations where net income looks positive but operating cash flow tells a contradictory story.
This is where a post-accounting layer like Kudwa becomes necessary. Instead of demanding a costly, high-risk rip-and-replace overhaul of your entire accounting system or ERP, Kudwa sits directly on top of your existing finance integrations. It connects fragmented bank accounts, separate ERP instances (such as Xero, QuickBooks, Zoho Books, or NetSuite), billing platforms, and operational spreadsheets into a single, cohesive finance view. This allows finance teams to track group-level cash, monitor real-time AR/AP aging impact, and build automated cash variance models without manual data manipulation.
The Pre-Purchase Verification Checklist
Before signing a contract for new cash software, run the vendor through these three operational tests during the demonstration phase:
- The unmapped transaction test: Ask the vendor to show exactly what happens when a subsidiary registers a transaction to an unmapped or new general ledger account code. Does the system break, or does it flag the exception while maintaining the integrity of the consolidated cash view?
- The sub-ledger drill-down test: Do not look at the executive dashboard. Ask the demonstrator to select a specific cash outflow anomaly on a chart and drill down to the exact invoice number and vendor record in less than three clicks.
- The dynamic timing test: Request a live demonstration of how the tool updates its cash runway forecast when an enterprise client's payment terms change from Net-30 to Net-90. If that adjustment requires manual data preparation or a CSV re-upload, the system is not truly integrated with your operational workflow.
Focus your evaluation on data pipeline integrity rather than visual polish. If the software cannot automate the collection, mapping, and normalization of your cash data across every operating entity, your team will continue to run their core analysis inside Excel.
If your cash process depends on manual bank exports, detached AR schedules, AP files, and disparate entity spreadsheets, see how Kudwa helps finance teams manage cash visibility across the stack.
Discover Kudwa's Cash Flow Management Layer
Latest from Kudwa

What Governed AI Actually Means in Finance
Governed AI in finance means outputs stay traceable to source data, finance rules, permissions, and review before decisions are made.

KSA E-Invoicing Timeline: ZATCA Fatoora Deadlines and Finance Readiness Checklist
Track the KSA e-invoicing timeline, ZATCA Phase 2 waves, Fatoora integration, and finance readiness checks for Saudi companies.