Financial research tools that consolidate fragmented financial data: why the problem is tooling, not discipline
Financial research tools that consolidate fragmented financial data help finance teams move from manual exports and spreadsheet rebuilds to one connected view.

Executive summary
- Real issue: Fragmented financial data is usually a systems problem, not a finance discipline problem.
- Local truth: Accounting tools, bank portals, payroll systems, and spreadsheets can each be correct while still failing to give one group-level answer.
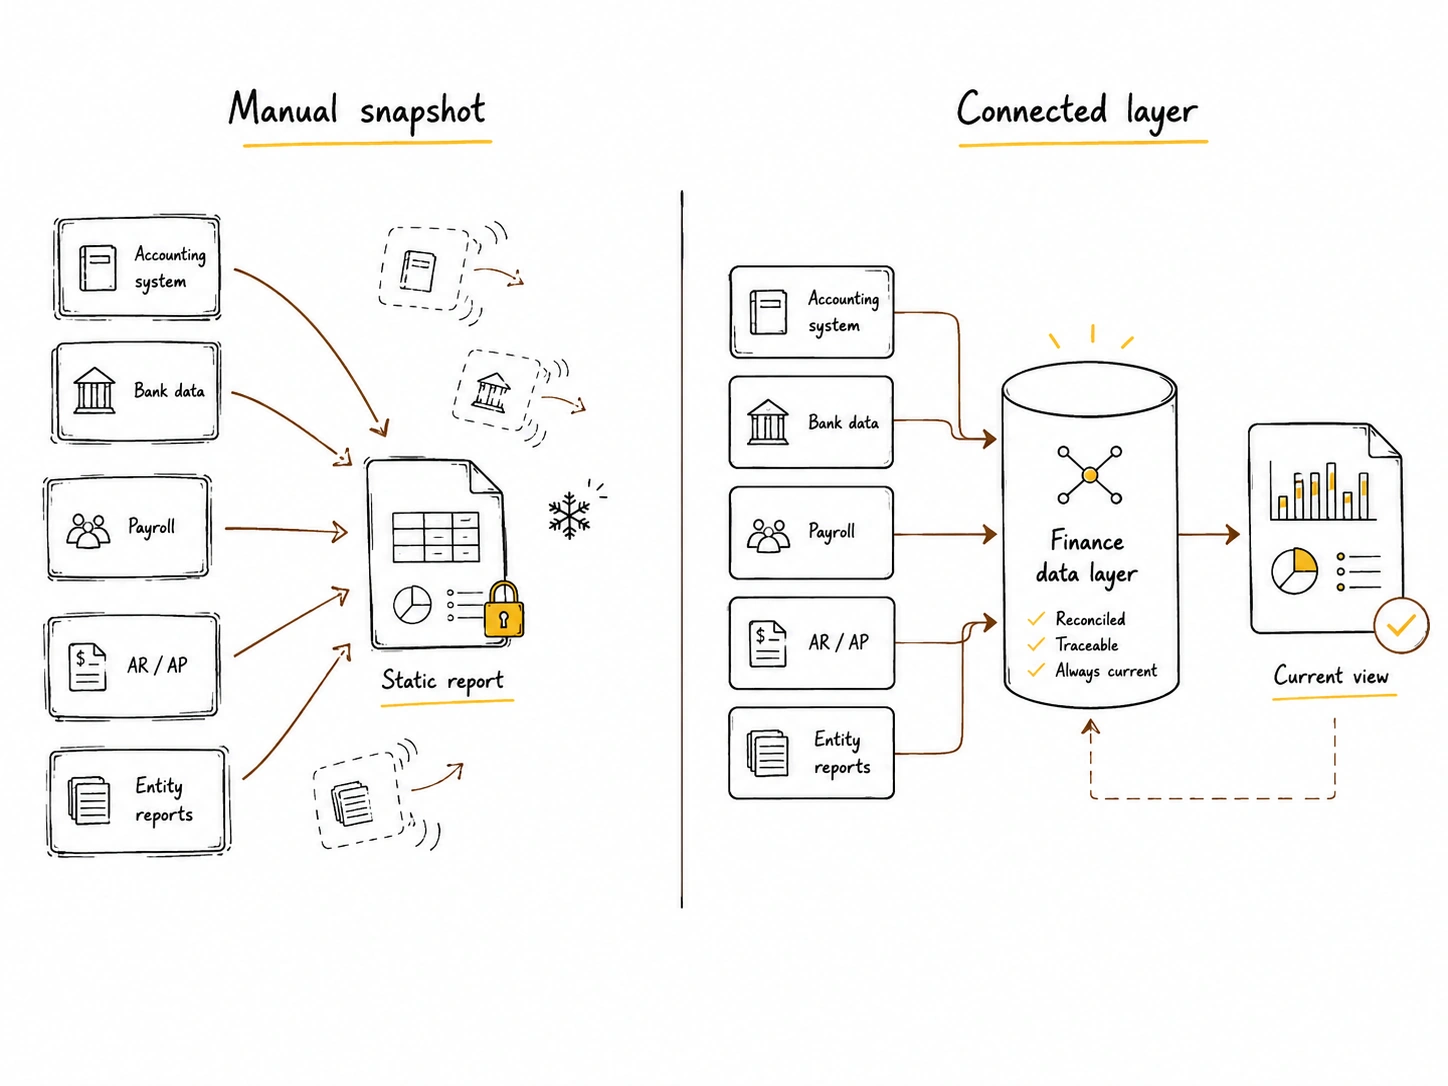
- Manual layer: The failure starts when consolidation happens in a person’s head and spreadsheet instead of in a connected system.
- Stale numbers: A consolidated answer can be right on Tuesday and wrong by Thursday because the source systems changed.
- Complexity point: The process breaks when source systems, entities, formats, currencies, and users multiply.
- System requirement: A stronger model connects to source systems, reconciles formats, keeps data current, and preserves traceability.
- Practical test: If every consolidated answer requires a new export, the team does not have a data layer. It has a recurring manual task.
A finance manager is asked a simple question in a board meeting:
How much did the group spend on payroll last quarter, across all entities?
The answer should be available in minutes. Instead, it takes two days, three exports, and one reconciliation argument.
The payroll system has one number. The accounting system has another. One entity codes employer contributions differently. One subsidiary runs payroll through a local provider. The board pack shows a total, but nobody is fully confident where the difference came from.
The numbers were not necessarily wrong.
They were never in the same place, in the same structure, at the same time.
That is the real problem financial research tools that consolidate fragmented financial data need to solve. Not “messy finance teams.” Not “poor spreadsheet discipline.” Not another dashboard placed on top of disconnected data.
Fragmentation is structural.
It happens because the finance stack was assembled around individual functions, not group-level decision-making.
Financial research tools that consolidate fragmented financial data solve a structural gap
Most finance systems are built to answer questions inside their own boundary.
The accounting system answers: what was recorded in the ledger?
The bank portal answers: what cleared through this account?
The payroll tool answers: what was processed this cycle?
The AR system answers: what customers owe?
The AP system answers: what suppliers are due?
Each tool can be accurate. Each can be the correct source for its own purpose.
But leadership rarely asks questions inside one system boundary.
They ask:
- How much cash do we actually have available across the group?
- Why did payroll increase in one entity but not another?
- Which customers explain the collections gap this month?
- How much of this variance is timing, coding, currency, or intercompany?
- Is this week’s cash position better or worse than last week’s?
Those questions require connected context.
That is where fragmentation appears. Not because finance failed to maintain order, but because the tools were never designed to agree at group level without assembly.
A finance team may not need to replace its accounting system, payroll system, or bank portals. It may need a connected layer above them. This is the same operating problem explained in What a Unified Financial Data Platform Actually Replaces in a Growing Finance Stack: the replacement is not always the underlying tools, but the manual coordination work between them.
Where fragmented financial data comes from
Fragmentation usually starts innocently.
A company begins with one accounting tool, one bank, and one spreadsheet. One finance person knows where the figures came from. One manual file can still explain the business.
Then the company adds entities, systems, regions, banks, payroll providers, payment flows, and reporting expectations.
The process still looks manageable from the outside. But inside finance, every answer now needs assembly.
1. Accounting systems hold the ledger, not the full operating context
The accounting system records transactions and supports close, audit, tax, and compliance.
But it does not always explain live operating movement.
A payroll expense may be posted correctly after close. That does not mean finance can instantly explain the movement by department, entity, employment type, or timing.
A bank transaction may be posted correctly. That does not mean the accounting system shows whether the group has usable cash today.
A customer invoice may be recognized correctly. That does not mean finance can see whether the customer will pay before the next supplier run.
The ledger is essential. It is not the full finance data layer.
2. Bank data lives outside the accounting tool
Bank portals are one of the biggest causes of fragmentation.
A group may have several bank accounts across entities and currencies. One entity may bank locally. Another may use a regional bank. A third may hold USD accounts for international collections.
The accounting system may show posted bank activity. But cash decisions often depend on live balances, pending transfers, uncleared payments, restricted funds, and timing differences.
For example, a UAE parent may see AED balances clearly, while a KSA subsidiary reports SAR collections two days later from a different bank export. Both numbers are valid locally. The group cash view still fails if those updates sit in separate systems and formats.
3. Payroll, AR, and AP sit in separate systems
Payroll, AR, and AP are not just accounting categories. They are operating flows.
Payroll has timing, headcount, department, employer contributions, bonuses, and local rules.
AR has invoice dates, due dates, customer behaviour, expected collections, disputes, and partial payments.
AP has supplier terms, payment priorities, approval status, and cash timing.
When these live in separate tools, the finance team can still close the books. But answering management questions becomes harder.
The issue is not whether the systems are individually correct. The issue is whether the company can combine them without rebuilding the answer manually.
4. Spreadsheets become the integration layer
At first, the spreadsheet is practical.
Finance exports the ledger. Then it exports bank balances. Then it adds payroll. Then it adjusts for intercompany. Then it creates a clean management view.
This works until the spreadsheet becomes the place where data is joined, cleaned, renamed, reconciled, explained, and trusted.
At that point, Excel is no longer just a calculation tool.
It is the company’s unofficial finance integration layer.
That creates a specific risk. The spreadsheet holds the logic of consolidation without maintaining a live connection to the underlying sources.
5. Every system is a source of truth for itself
This is the uncomfortable part.
The accounting system can be right. The bank can be right. Payroll can be right. The AR file can be right. The spreadsheet can be right at the moment it was prepared.
But the group still has no controlled answer if those truths are not reconciled into one current view.
A “source of truth” is only useful if it matches the question being asked.
For a group-level question, the source of truth cannot be one isolated system. It has to be the reconciled view across systems.
The failure mechanism: consolidation happens once, then decays
The core failure is simple:
Consolidation happens as a one-time manual act, not as a living connected layer.
Take a cash example.
The group wants total available cash.
The analyst exports balances from four bank portals. Then they pull the ledger from the accounting tool. They adjust for two intercompany transfers. They remove one restricted account. They assemble the view in Excel.
The number is correct on Tuesday.
By Thursday, two balances have moved. One transfer has cleared. A customer payment has landed in one entity. A supplier payment has gone out from another.
The spreadsheet is now wrong.
Nobody necessarily knows it is wrong until the next manual rebuild.
The process did not fail mathematically. The analyst did the work properly. The spreadsheet logic may have been sound.
The process failed because the consolidated number was detached from the systems that keep changing.
This is where stale financial information becomes a decision risk. A board or management team can make a real decision from a number that was correct when prepared but no longer current when used. That connects directly to a broader issue covered in What is the biggest financial risk for companies?: the dangerous number is often not obviously wrong. It is outdated, incomplete, or missing context.
Why the current process works at first
Manual consolidation is not irrational.
It works when the company is small enough for one person to understand the whole data map.
It works when there are only a few systems.
It works when leadership accepts monthly answers.
It works when the company has one currency, one entity, one accounting file, and limited reporting complexity.
It works when only one person needs the output.
In that environment, a spreadsheet can be fast, flexible, and clear.
The problem is that the same process often remains in place after the operating model changes.
A process built for one entity is stretched across five. A spreadsheet built for monthly reporting is reused for weekly cash decisions. A file owned by one analyst becomes the basis for a board answer. A static export becomes the working view of a moving business.
That is the point where the process stops being flexible and starts becoming fragile.
Where complexity increases
Fragmentation becomes more expensive when several things happen at once.
Source systems grow past three or four
One accounting tool plus one bank portal plus one payroll system may be manageable.
Add a second accounting system, three more banks, a separate AP workflow, a CRM, and regional payroll providers, and every answer becomes a coordination exercise.
The time cost compounds because every source needs mapping to every other source.
Data arrives in different formats and timings
One bank export uses one date format. Another uses a different currency field. One payroll file updates monthly. AR aging updates daily. AP approvals change during the week. The accounting system only reflects part of this after posting.
Finance is then forced to decide which timing to trust for each question.
That is not a discipline issue. It is a data model issue.
The same entity appears differently across systems
This is common in multi-entity groups.
The same entity may appear under a legal name in the accounting system, a short name in the bank portal, a local naming convention in payroll, and a management label in the reporting pack.
The result is not just untidy naming. It creates reconciliation risk.
If an entity is not mapped consistently, group reporting depends on whoever remembers the translation.
Historical comparisons become harder
A spreadsheet can show today’s answer. But leadership often asks why today’s answer differs from last week’s, last month’s, or the prior forecast.
If each report was rebuilt manually, historical comparison becomes difficult.
The team has to reconstruct not only the number, but the source logic behind the number.
That is why traceability matters. The problem is not only “what is the figure?” It is “what changed, where did it come from, and why does it differ from the last version?”
More than one person needs the same view
A spreadsheet owned by one analyst can work for one analyst.
It becomes weaker when the CFO, finance manager, CEO, and department leads all need a consistent view.
One person looks at yesterday’s cash file. Another looks at a refreshed bank export. A third uses the board pack number.
Everyone is using finance data.
They are not using the same finance view.
This is where lean teams feel the strain first. The team does not necessarily need more people. It needs less manual rebuilding of the same answers. That is the operating point behind How Lean Finance Teams Can Run Serious Reporting Without Adding Headcount.
Capability checklist: what a consolidating layer must actually do
Not every reporting tool solves fragmentation.
A dashboard can display fragmented data. A spreadsheet can combine fragmented data. A BI tool can visualise fragmented data.
None of that means finance has solved consolidation.
A real consolidating layer needs specific capabilities.
The first test is whether the system connects to the underlying sources or simply receives files.
Exports may still be needed in some cases. But if the core process depends on repeated downloading and uploading, the consolidation is still manual.
The second test is whether the tool reconciles differences. Connection alone is not enough. If finance still has to clean entity names, recode categories, and manually match bank data to ledger data, the team has only moved the cleanup into another interface.
The third test is traceability.
Finance cannot trust a consolidated number if it cannot explain where the number came from.
Every figure should preserve the link back to the source data behind it: system, entity, account, transaction, date, and adjustment logic where relevant.
This is where connected finance data becomes useful. Not as a slogan, but as an operating requirement: the analysis is only as reliable as the data layer underneath it.
Once the data is connected and traceable, financial analysis becomes less about rebuilding inputs and more about explaining movement, risk, and options.
What finance should check before choosing a tool
Before choosing financial research tools that consolidate fragmented financial data, finance teams should test the tool against the real operating process.
Ask:
- Does it connect to the actual systems finance uses?
- Can it map entities consistently across systems?
- Can it reconcile bank, ledger, payroll, AR, and AP data?
- Does it keep the consolidated view current?
- Can users drill back to source?
- Can it preserve locked reporting snapshots?
- Can multiple users work from the same view?
- Does it explain differences between periods?
- Does it reduce manual rebuilds?
The most important question is the last one.
If producing a consolidated figure still requires the team to re-export, rename, adjust, and rebuild the view every time, the company has not solved fragmentation.
It has only improved the spreadsheet around it.
Where software becomes necessary
A system becomes necessary when the consolidated view needs to be reliable, current, and traceable at the same time.
A spreadsheet can sometimes be reliable and traceable if carefully built.
A dashboard can sometimes be current if connected to live data.
But finance needs all three.
Reliable means the number follows controlled logic.
Current means the number reflects source movement without manual rebuilding.
Traceable means finance can explain where the number came from and why it changed.
When leadership asks for a group-level answer, the finance team should not have to rebuild the company’s data model from exports.
The operating model should already exist.
This is where a post-accounting layer such as Kudwa can help: not by replacing the accounting system, but by connecting bank, accounting, entity, and reporting data into one controlled finance view.
The practical takeaway is simple.
Fragmented financial data is not fixed by asking finance to be more disciplined with exports. It is fixed by moving consolidation out of individual files and into a connected layer that stays aligned with the systems underneath.
See how Kudwa consolidates fragmented finance data from your existing systems into one connected, traceable view.
Latest from Kudwa

Consolidating Entities You Don’t Fully Own: JV, Local Sponsor, and Minority Interest Reporting in the GCC
Learn how minority interest and JV consolidation affect the group P&L, balance sheet, and monthly reporting workflow across GCC entities.

Free Zone vs Mainland Ownership: What It Means for Your Group Consolidation
Understand how free zone vs mainland UAE ownership affects control, non-controlling interests, consolidation, and group reporting.