Forecast vs Actual Reporting: Why the Variance Matters Less Than the Driver
Forecast vs actual reporting should explain timing, volume, price, mix, and one-offs so leaders can act on the real variance driver.

Executive summary
- A variance number is only useful when finance can explain what caused it.
- Timing, price, volume, mix, and classification issues require different management responses.
- Forecast accuracy should be judged against the assumptions behind the forecast, not only the final number.
- Better reporting connects actuals, forecast assumptions, operational data, and commentary in one repeatable process.
The forecast review starts with a clean number: revenue is 9% below forecast. Forecast vs actual reporting has done its first job. It has shown the gap.
But the room still cannot make a decision. Sales says two enterprise invoices slipped into next month. Customer success points to churn from one large account. The CEO asks whether discounting increased. The finance manager says recognized revenue is below plan, but collections are roughly on track.
The variance is visible while the driver is not.
Why forecast vs actual reporting often stops too early
Most forecast vs actual reporting stops at the comparison layer. Actual revenue, gross margin, payroll, opex, and cash are placed beside forecast, then the report highlights the percentage movement. That is useful for orientation, but it is not enough for management action.
A 9% revenue miss can come from delayed invoicing, lower deal volume, heavier discounting, poor renewal performance, product mix, or recognition timing. Each driver requires a different response. Treating them as one “revenue variance” pushes leadership into broad commentary instead of targeted decisions.
The same issue appears across costs. A marketing overspend can reflect a campaign pulled forward from next month, an unplanned agency fee, higher paid media prices, or a classification correction from sales expense. The movement looks the same in the summary report, but the operating meaning is different.
That is why finance should not measure the quality of a forecast review by whether it finds the gap. The stronger test is whether the report separates the gap into causes that management can act on.
The difference between variance and variance driver
A variance is the difference between what finance expected and what happened. A variance driver explains why the difference exists. That distinction sounds simple, but it changes the whole reporting conversation.
Assume SaaS revenue was forecast at $500,000 and actual revenue came in at $455,000. The report shows a $45,000 negative variance. If finance stops there, leadership may assume the sales team underperformed. But the driver analysis might show something else: $20,000 from delayed onboarding, $15,000 from one churned customer, $7,000 from FX movement, and $3,000 from a billing classification correction.
Only one part of that variance is directly related to sales performance. The rest belongs to implementation timing, retention, currency, and data classification. Without that separation, the wrong team may be challenged and the wrong corrective action may be taken.
This is closely related to the granularity gap. A report can be technically accurate at the top level while still lacking the detail needed to explain operational movement.
The drivers finance should separate
Finance does not need a different driver model for every line item. It needs a consistent framework that separates the most common causes of movement before commentary is written.
This framework prevents finance from using one explanation for different issues. A timing variance should not be treated like weak demand. A one-off item should not be treated like a recurring cost trend. A classification issue should not become a budget fight.
The purpose is not to make every forecast perfectly accurate. It is to make the variance review more useful than a list of misses and beats.
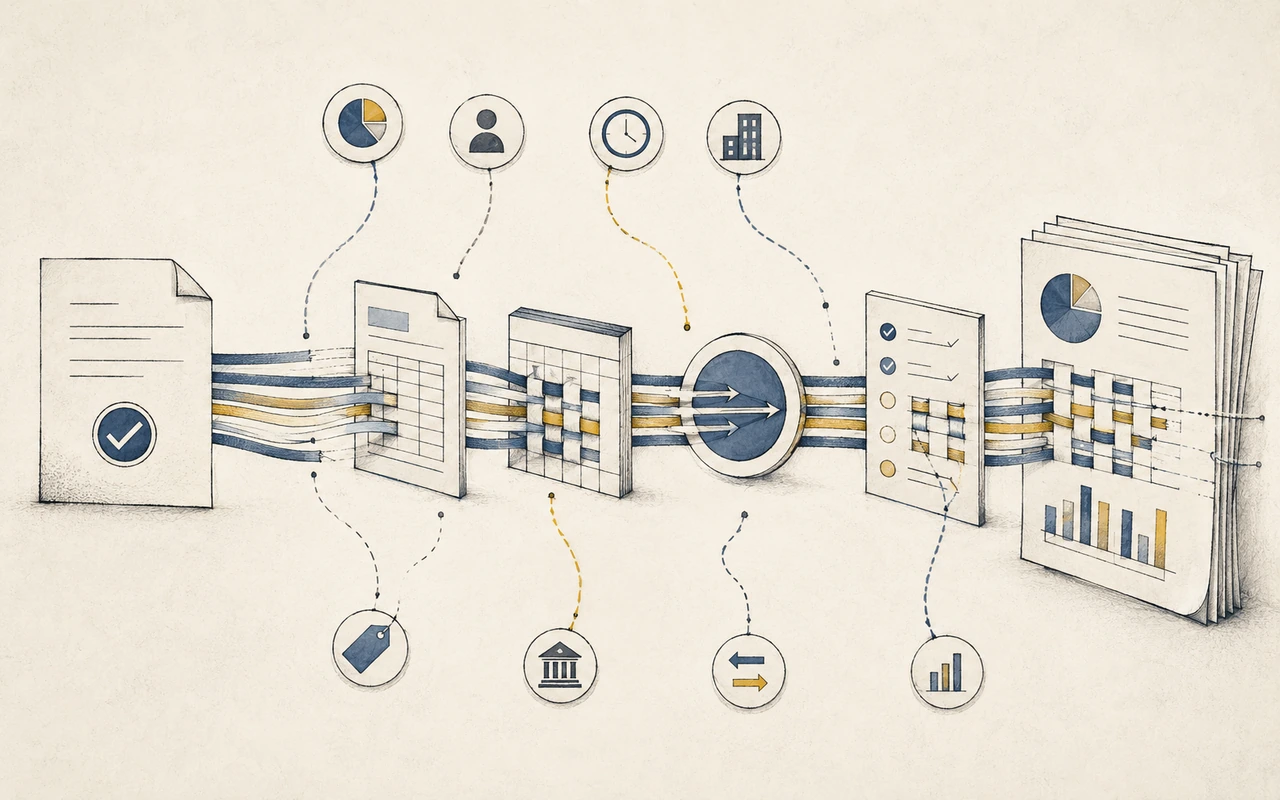
Forecast vs actual reporting framework
A stronger forecast vs actual reporting process should move through four layers.
First, show the variance clearly. Finance still needs the basic comparison by line item, entity, department, or business unit. The report should make it obvious where the material gaps are.
Second, assign the driver. Each material variance should be tagged as timing, volume, pricing, mix, operational change, one-off, or classification. If the driver is unknown, that should be visible too. “Unknown” is better than forcing weak commentary into the pack.
Third, connect the driver to the original assumption. If revenue missed because onboarding slipped, the forecast assumption was not only about sales volume. It also depended on implementation capacity and billing start dates. If payroll was below forecast because hiring moved out, the forecast assumption was tied to recruiting timing, not compensation control.
Fourth, state the management implication. A timing variance may require forecast phasing. A volume variance may require pipeline review. A pricing variance may require margin discussion. A classification variance may require cleaner coding rules, not a business correction.
This structure also reduces budget-owner disputes. Instead of arguing whether the number is “right,” finance can focus the conversation on what changed and whether the forecast assumption needs to be updated.
What changes when forecasts become more operational
Forecasts become harder to explain when they depend on more operational inputs. Revenue depends on pipeline stage, billing rules, onboarding capacity, churn risk, and collection timing. Payroll depends on start dates, visa timing, department allocation, bonuses, and contractor conversions. Cash depends on invoicing, collections, AP scheduling, payroll, tax payments, and entity-level restrictions.
At that point, variance analysis cannot live only in the finance file. The actuals, assumptions, source data, and commentary need to stay connected. Otherwise finance rebuilds the same explanation each month from exports, budget files, CRM notes, HR updates, and bank movements.
This is where the reporting risk becomes broader than forecast accuracy. If leadership cannot understand what caused a miss, they may cut spend when the issue was timing, push sales when the issue was onboarding capacity, or ignore a recurring margin problem because it was buried inside a total revenue line. That connects to what the biggest financial risk for companies actually is: decisions made from numbers that are technically available but operationally incomplete.
A post-accounting layer such as Kudwa can help when finance needs to connect actuals, forecast assumptions, operational drivers, and commentary without replacing the ERP or accounting system. This is also the distinction behind Unified Financial Data Platform vs BI vs ERP: BI can display variance, the ERP can hold transactions, but finance still needs a controlled layer that explains why the variance happened.
Practical takeaway
Forecast vs actual reporting should not end with the percentage movement. The variance tells leadership where to look. The driver tells them what to do.
Finance teams should review their current variance reports and ask whether each material movement is classified by cause. If the commentary says “below forecast due to timing,” does the report show what moved, when it moved, and whether the full-year view changed? If it says “higher costs,” does it separate volume, pricing, mix, and one-offs? If it says “sales underperformed,” does it prove that the miss was sales volume rather than billing timing or implementation delay?
The better operating model is not more commentary. It is a reporting process where actuals, assumptions, drivers, and decisions are connected before the forecast review begins.
If your forecast reviews show the variance but not the driver, the reporting process is stopping too early. See how Kudwa supports finance analysis and forecasting across your existing finance data.
Latest from Kudwa

Finance Data Reconciliation Across Systems: Where Reports Start Breaking Before Month-End
Finance data reconciliation across systems helps teams explain revenue, payroll, billing, bank, and operational gaps before month-end reports break.
Approval Workflow for Finance Teams: Why Approved Spend Still Creates Reporting Problems
Approval workflow for finance teams should capture budget, vendor, timing, and reporting context before invoices reach accounting.